You’re staring at the same trading charts as everyone else, Head and shoulders, Double tops, Flags, Pennants, and so is every other retail trader on the planet.
Here’s the problem: By the time those textbook trading patterns look obvious, smart money has already positioned itself, and late traders are walking straight into a trap.
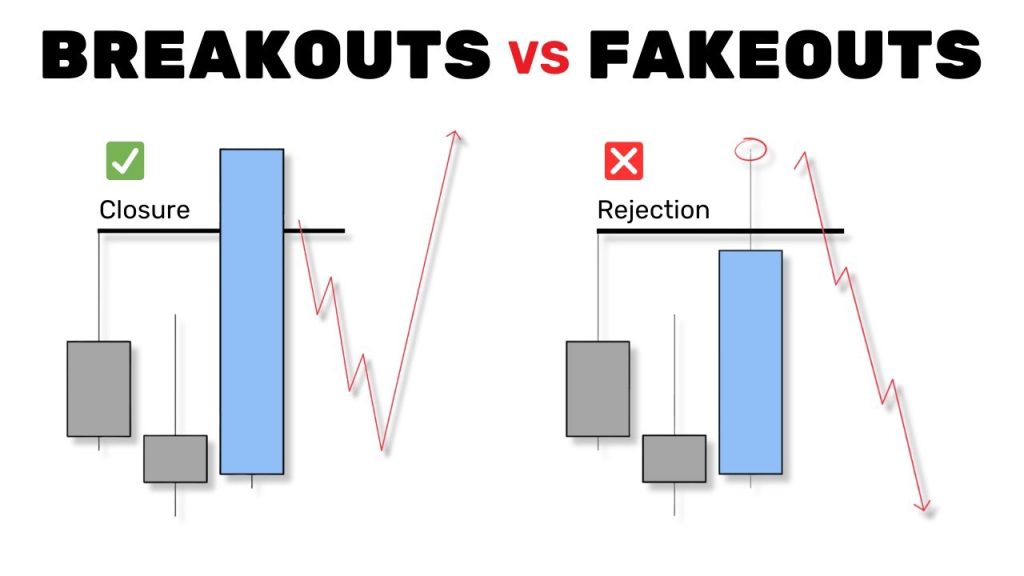
The real trading edge isn’t just spotting chart patterns — it’s understanding the psychology behind price action, recognizing trading patterns that expose market fake breakouts, and identifying where traders get trapped. A false breakout isn’t random, It’s a message.
Think of it like a boxer throwing a fake jab. The goal isn’t to land the punch — it’s to make you react.
This article breaks down 5 hidden trading patterns that expose market fake outs These setups appear every single week across stocks, futures, and crypto. Each one reveals market traps, failed breakouts, and smart money behavior before the next big move begins.
The Problem with Obvious Trading Patterns
Classic chart patterns work — when they’re properly confirmed. Head and shoulders patterns, double bottoms, and breakouts all have statistical edges.
But here’s what most traders miss:
failed patterns often create the biggest opportunities.
Markets are auctions hunting for liquidity. Institutions need size, but they can’t enter quietly without triggering reactions. So they push price just beyond obvious support or resistance levels, triggering stop-losses and breakout orders.
That’s a fakeout.
Trapped traders fuel the reversal, accelerating the move in the opposite direction. If you learn to recognize these failed moves, you stop being liquidity — and start trading alongside it.
Pattern 1: Simple Hidden Trading Pattern (SHTP) – Fake Trendline Break
One of the most common traps in technical analysis is the failed trendline breakout.
In a clear downtrend, price breaks above a minor trendline. Inexperienced traders assume a reversal, they buy, then price immediately collapses back into the dominant trend.
This pattern works because market trend never truly changes.
How to Trade the SHTP
- Setup: Strong existing trend with a minor trendline break
- Entry: After price reclaims the trend and momentum resumes
- Stop-Loss: Above the failed breakout high
- Target: Prior swing low in the dominant trend
This setup rewards patience, not prediction.
Pattern 2: The Swing Trap Pattern
The Swing Trap is designed to punish traders who chase breakdowns.
Price consolidates in an uptrend with clear support. Stops stack below it. Short sellers wait.
Price breaks support briefly — then violently reverses.
Trade Plan
- Setup: Consolidation within an uptrend
- Entry: After price aggressively reclaims support
- Stop-Loss: Below the false breakdown low
- Target: Top of the range (minimum 2:1 R/R)
This is crowd psychology in real time.
Pattern 3: The Ghost Town Pattern
This pattern hides in low-volume consolidation zones.
After a strong move, price goes quiet. Volume dries up. Most traders get bored and leave.
That silence often signals institutional accumulation.
How to Trade It
- Setup: Tight, low-volume range after a strong trend
- Entry: Breakout with a sharp volume expansion
- Stop-Loss: Below the consolidation low
- Target: Hold for trend continuation until reversal signals appear
The move doesn’t start loud — it ends loud.
Pattern 4: The T-30 Time-Based Pattern
After a strong advance, markets often consolidate for about 30 days.
This time compression frustrates impatient traders and transfers shares to stronger hands.
Execution
- Setup: Strong uptrend + ~30-day tightening range
- Entry: Breakout on above-average volume
- Stop-Loss: Below consolidation low
- Target: Project the base height upward from breakout
Time builds pressure. Pressure creates expansion.
Pattern 5: The Side Trap Pattern
In a sideways range, traders buy support and sell resistance — until support breaks.
That breakdown is often fake.
Price dips below support, triggers stops, traps shorts, then reverses sharply back into the range.
Trade Setup
- Setup: Clean horizontal trading range
- Entry: After price reclaims broken support
- Stop-Loss: Below false breakdown low
- Target: Opposite side of the range
Failed moves often lead to full range rotations.
These are 5 hidden trading patterns that can trapped traders.
Markets constantly test participants. These setups teach you to wait for confirmation, question obvious moves, and trade what price is actually doing.
Backtest these patterns. Study failed breakouts. Watch how trapped traders fuel reversals.
They aren’t magic — but they can shift how you see the markets based on an emotioanal reaction.
If you want to go deeper and see these strategies applied in real time, check the link in the description and join the newsletter.
Trade smart.