
Northern & Southern DoJi candlesticks
In this compelling video, Maverick Trading breaks down why doji candlesticks are more powerful thatn you think. — a deceptively simple chart pattern that carries far more weight than many traders realize. Whether you’re just getting started in technical analysis or you’re a seasoned trader hunting for subtle edge, the concepts presented here can sharpen your awareness of trend-reversals, momentum shifts, and market indecision.
What are Doji Candlesticks?
At its core, a Doji is a candlestick pattern in which the opening and closing prices are virtually identical — resulting in a very small “real body”. This implies that, during the trading period, neither bulls nor bears dominated. As noted by Investopedia:
“A doji is a candlestick pattern … where a security’s opening and closing prices are nearly identical, forming a cross or plus sign shape.”
The video introduces this concept clearly, emphasizing that while the Doji may appear visually modest, its context-driven meaning can be profound: it signals indecision between buyers and sellers — which often precedes a meaningful move.
Why Doji candlesticks Carry Extra Weight
In the video, the Maverick team emphasizes a few key points that elevate the Doji candle from simple curiosity to a high-probability signal:
- Location matters. A Doji at the end of a strong uptrend or downtrend is far more significant than one in a sideways or choppy market. As one analysis explains: “If the Doji candle appears in an uptrend or downtrend, this is normally seen as significant, as the buyers are losing conviction when formed in an up-trend and sellers are losing conviction if seen in a down-trend.”
- Confirmation is critical. The video walks through how a Doji alone isn’t a trade trigger — what matters is what happens next: the break, the confirmation candle, the volume. This aligns with broader commentary: “Traders should review other indicators before taking action on a trade.”
- Volume and trend-context boost reliability. The video shows that when a Doji appears after a strong trend and near a support/resistance zone, the probability of a reversal or strong move increases. This echoes the commentary from CQG on Doji patterns.
Key Variations of Doji candlestick to Know
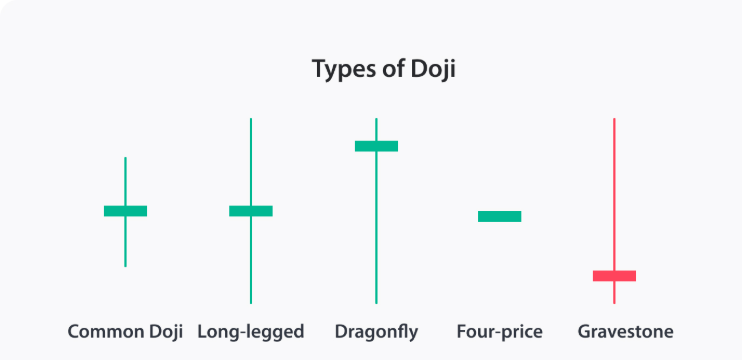
The video covers several forms of Doji, helping traders learn how to “read” the pattern more precisely:
- Basic Doji: open and close almost the same, shadows may vary.
- Long-legged Doji: very long wicks on both top and bottom, signaling high indecision.
- Dragonfly Doji: long lower shadow, little to no upper shadow
- Gravestone Doji: long upper shadow, little to no lower shadow
- For more information on candle patterns and probability visit The Pattern site by Bulkowski
How to Trade a Doji Candlestick — Maverick Trading’s Approach
The video highlights how discerning the difference between these types, and their placement in the broader chart context, can help traders make more informed decisions.
Here’s how Maverick Trading recommends leveraging Doji candle patterns (as outlined in the video) to boost your trading edge:
- Spot the Doji candlestick in a meaningful context. Look for the pattern after a strong prior move (up or down).
- Check for confirmation. Wait for the candle that follows the Doji to validate the move (a breakout or reversal).
- Manage risk. Use stop-loss orders below/above the Doji candle’s shadow (depending on direction).
- Combine with other indicators. Volume surges, RSI or Stochastics (overbought/oversold), and trend strength amplify the signal’s odds.
- Avoid “false positives.” The video stresses that not all Dojis will lead to strong moves. Trading blindly on a Doji without confirmation is risky.
Real-World Example from the Video
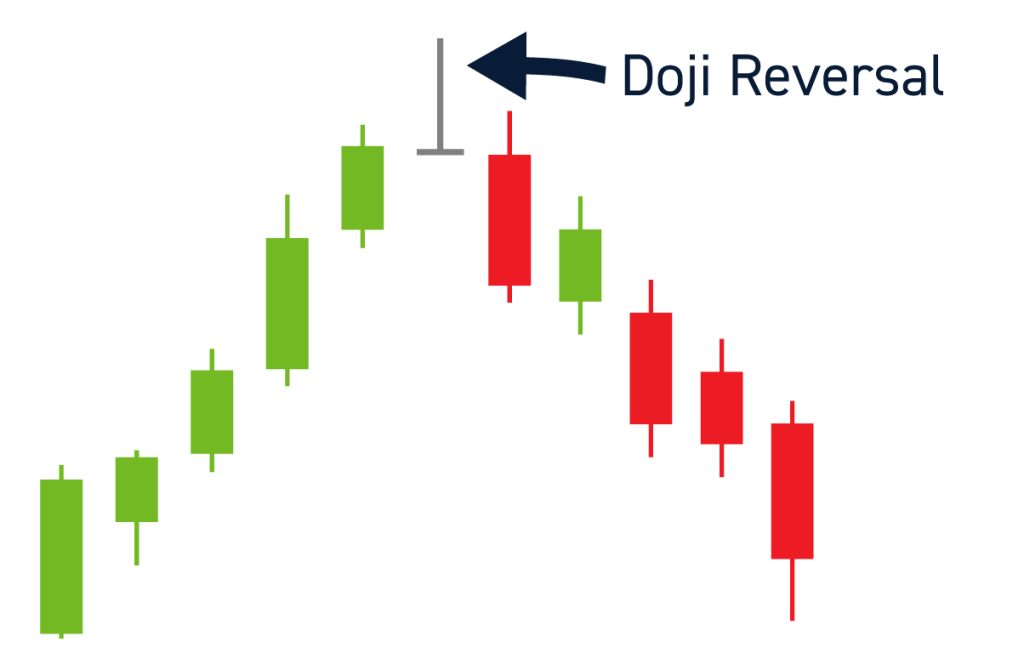
In the video, Maverick’s instructor walks through a live chart where a Doji candle appears at the end of an extended uptrend. After the Doji candle forms, the next session opens with a gap down and closes decisively lower, marking the start of a trend reversal. This tangible example helps illustrate the sequence: trend → indecision (Doji) → shift in momentum.
The video reinforces how the Doji candle is the turning point signal, not the signal itself. The follow-through is what confirms the move.
Why This Matters for Traders
Understanding Doji candlesticks is a powerful addition to any trader’s toolkit, and here’s why:
- Early warning of momentum shift. When a Doji occurs after a strong directional move, it may hint that the prevailing trend is out of steam and ready to change.
- Enhanced decision-making. Instead of reacting randomly, you can use the appearance of a Doji to heighten awareness and prepare for a trading opportunity.
- Maximizing risk/reward. Because a Doji can signal a pivot, entering after confirmation can result in more favorable trade setups (tight stops, larger potential moves).
- Greater confidence in chart work. For traders using technical analysis, recognizing candlestick signals (like the Doji) increases chart fluency and pattern recognition.
Final Thoughts
If you’re looking to strengthen your technical analysis skills and gain an edge in reading market sentiment, the video “Why Doji Candlesticks Are More Powerful Than You Think” is a must-watch. By understanding the simple yet potent Doji candlestick pattern and applying it in the right context, you’ll give yourself a better chance of spotting turning points and acting with confidence.
And remember — the appearance of a Doji is not the trade in itself. It’s the alert that something may be shifting. The real trade begins when you see the follow-through.
Explore the video, study the chart examples, and then incorporate the Doji methodology into your trading plan. With disciplined application, this signal can become a valuable component of your technical-analysis toolbox.


1 Comment