Finviz Review (2025): Features, Pricing, and Why Traders Love This Lightning-Fast Stock Screener
Finding the single, high-probability trade among the thousands of available stocks on any given day is the definitive challenge for both active traders and long-term investors. How often have you spent hours sifting through spreadsheet-like data, only to suffer from data paralysis—the inability to pull the trigger because the information is slow, overwhelming, and unintuitive? The typical stock screener is often a functional necessity but a visual headache. The need for speed, efficiency, and clarity in market analysis has never been greater. Enter Finviz.com. Finviz has built a massive following by solving the data dilemma, offering a platform renowned for its lightning-fast screening capabilities and its unique visual data presentation, including the famous heat maps. This comprehensive Finviz review will dissect the platform’s core components, compare the features available in the Free vs. Finviz Elite tiers, and deliver a final verdict on whether this powerful tool should be the cornerstone of your daily trade preparation.
Finviz.com Overview: The Visual Gateway
Finviz, an abbreviation for “Financial Visualization,” was launched with a single mission: to present complex market data in the most efficient and visual manner possible. Unlike traditional financial platforms that are chart-heavy or rely on endless lists, Finviz prioritizes visualization tools and sheer speed. The platform primarily serves as a powerful stock screener and a dynamic market overview tool. While it doesn’t aim to be a comprehensive trading platform with integrated brokerage capabilities, it excels as the definitive pre-market and end-of-day market scanning engine. The entire user experience is built around minimizing clicks and maximizing the information density of the screen. For traders who need to assess hundreds of tickers or monitor global sector performance within seconds, Finviz acts as the critical visual gateway to the stock market. Its simple, clean interface—a hallmark of its design—contrasts sharply with the complexity of the data it processes. This singular focus on speed and efficiency is what has cemented its position as a staple tool for both retail and institutional traders globally.
Key Feature 1: The World-Class Stock Screener
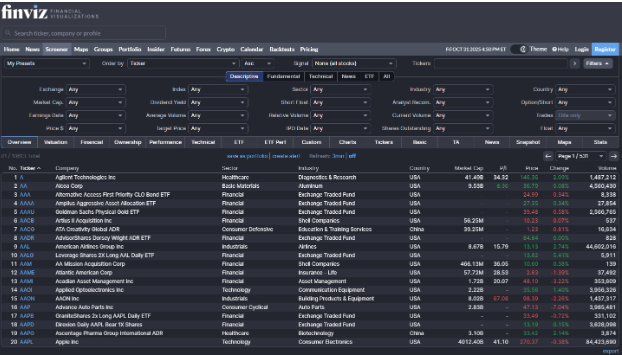
The cornerstone of the Finviz platform is, without question, its world-class stock screener. This is where the platform truly dominates its competition. The efficiency and speed of the Finviz screener are virtually unmatched, allowing traders to filter through thousands of stocks in under a second. The screener is logically divided into three main categories of filters:
- Descriptive: This covers basic company attributes, including Exchange (NASDAQ, NYSE), Sector, Industry, Country, Market Capitalization, and Average Volume. These are essential for narrowing the universe down to relevant markets.
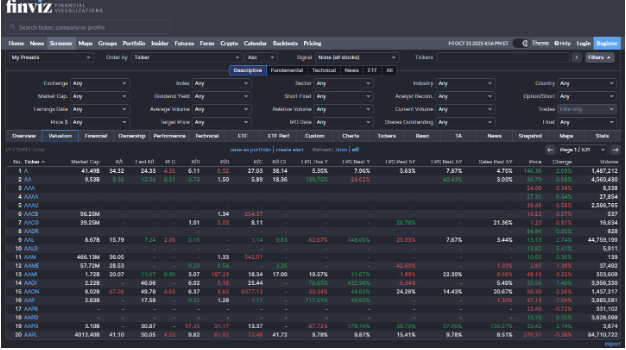
2. Fundamental: This is critical for value and growth investors, offering metrics like P/E Ratio, PEG Ratio, Insider Ownership, Return on Equity (ROE), and Sales Growth. Applying even three or four fundamental filters instantly generates a highly specific watch list.
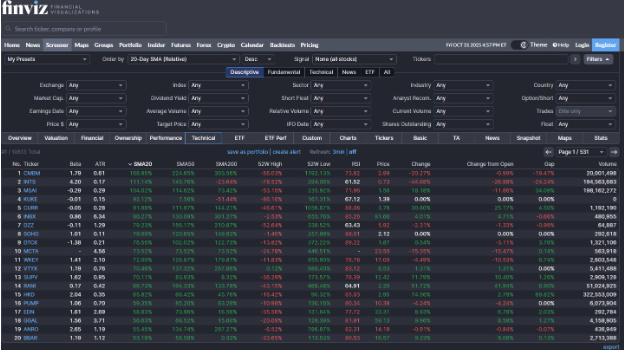
3. Technical: This is the domain of active traders, where you can filter based on candlestick patterns, performance relative to key moving averages (e.g., Price 20-day Simple Moving Average), and relative strength indicators (like RSI).
The power of the screener lies in its ability to combine complex filters rapidly. A swing trader, for example, could instantly scan for “stocks in the Technology sector, with high institutional ownership, trading above their 200-day moving average, and exhibiting a Rising Triangle pattern.” This level of granular, combined filtering is what saves traders hours of manual charting and list building every week, providing trading efficiency unmatched by many paid terminal services. The ability to save these custom filters and instantly recall them is a massive time-saver for developing consistent daily routines.

Key Feature 2: Market Maps and Performance Groups
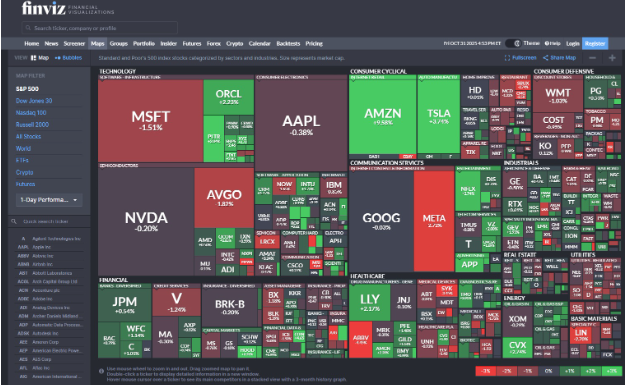
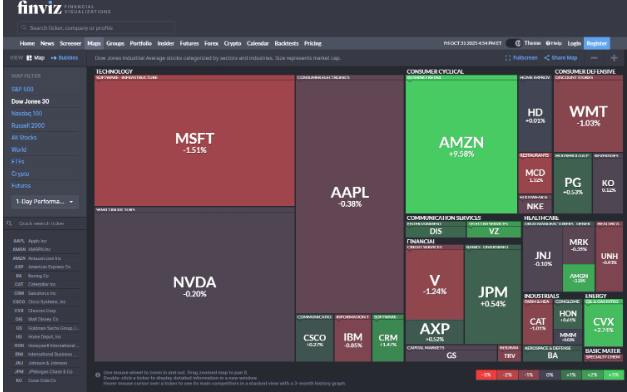
Finviz is perhaps best known for its iconic Market Maps—a powerful visualization tool that immediately provides a high-level view of daily or weekly sector performance. Instead of scrolling through lengthy indices, the Market Map presents the entire U.S. market as a dynamic, color-coded grid. Each rectangle on the map represents a company, and the size of the rectangle is relative to its market capitalization. The color—shades of green or red—indicates the stock’s performance for the selected time frame.
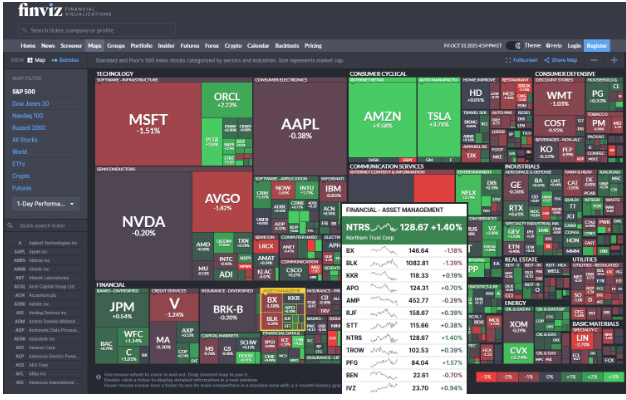
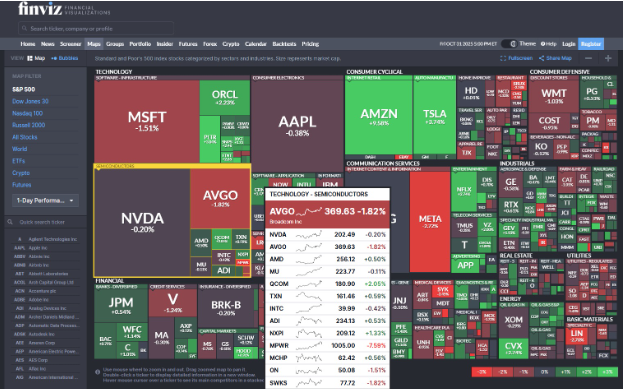
This visual representation is invaluable for macro analysis. A trader can immediately see which sectors (e.g., Technology or Financials) are driving market momentum, or which sub-industries within a sector are experiencing the deepest sell-off. For example, a map showing deep green across all segments except for the Utilities sector instantly highlights where capital is flowing and where it’s being pulled. Finviz allows users to zoom in on specific sectors, viewing the performance of individual stocks within that group. This provides critical context, showing if a broad move is index-driven (everything is red) or specific to certain industry group breakdown (only housing stocks are red while the rest of financials are green). Understanding these performance groups is essential for intermarket analysis and selecting the strongest candidates for a trade, giving traders an almost instantaneous read on the market’s collective pulse.
Key Feature 3: News, Futures, and Forex Data
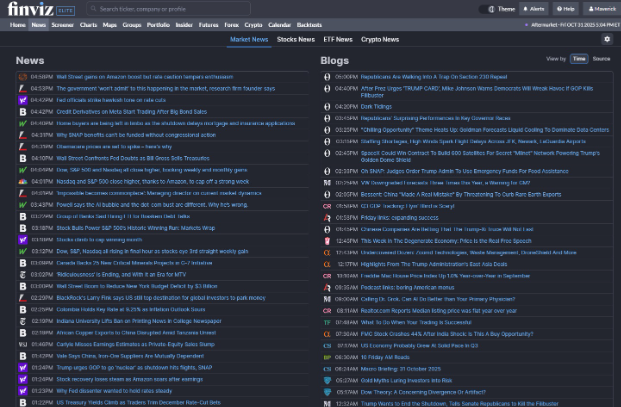
Beyond stocks, Finviz provides a surprising breadth of non-equity market data that serves the needs of traders looking at the broader financial landscape. The site features a sophisticated news feed clustering system. Rather than displaying a chronological list of headlines, Finviz groups identical stories from different sources together, labeling them with a single headline and showing the various contributing sources. This filtering mechanism drastically reduces the noise inherent in traditional financial news feeds, ensuring you read only unique, breaking developments.
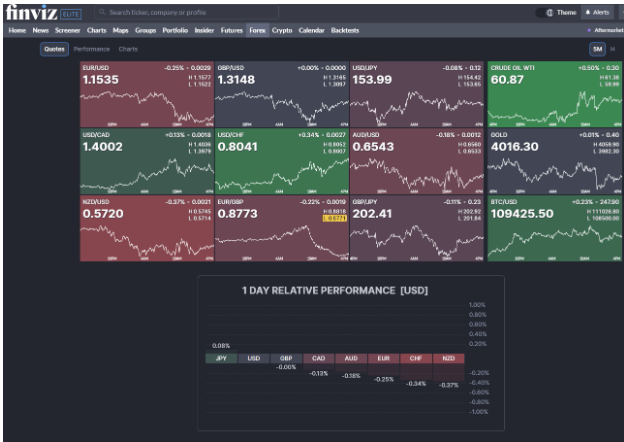
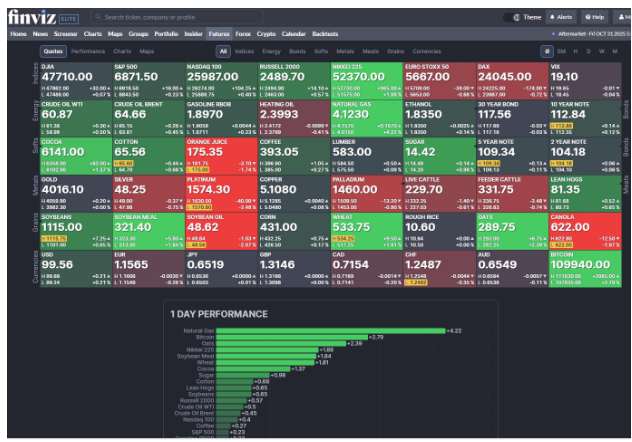
Furthermore, Finviz includes up-to-the-minute data on Futures and Forex markets. The inclusion of major currency pairs (like EUR/USD) and commodity contracts (such as Crude Oil and Gold) allows for crucial intermarket analysis—the practice of viewing how different asset classes influence one another. For example, a swing trader looking at energy stocks might simultaneously monitor the price trend of the underlying Crude Oil futures, a key driver for the entire Energy sector. While the charting capabilities for futures and forex may not be as robust as a dedicated platform, the data serves its purpose as a reliable and accessible reference point. The ability to quickly check market indexes, global performance, and currency trends on a single, efficient dashboard reinforces Finviz’s value as a universal market monitoring tool.
Key Feature 4: Pricing Breakdown: Free vs. Elite
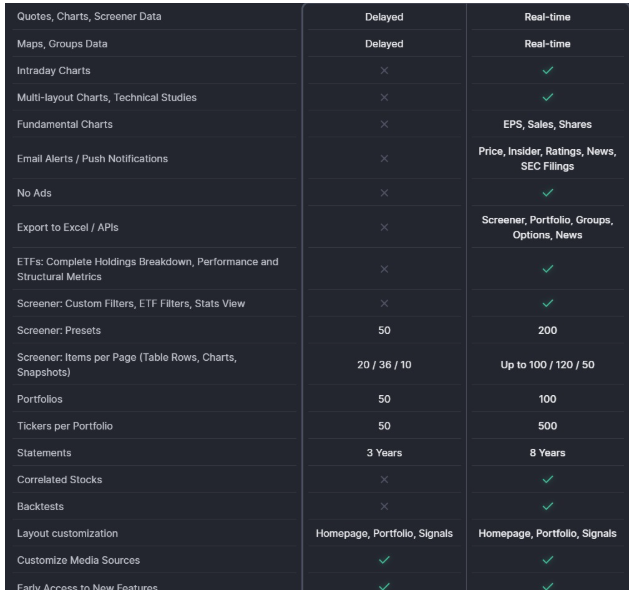
One of Finviz’s main attractions is its powerful, fully functional Free tier. However, serious, active traders will quickly find that the limitations of the free version necessitate an upgrade to Finviz Elite. The distinction between the two tiers hinges primarily on speed, data quality, and customization.
The Free tier offers the core Finviz experience: access to the lightning-fast screener, all major filters, and the popular heat maps. The chief drawback is that the data is delayed by 3 to 5 minutes—a critical issue for day traders or those executing quick entries and exits. The free tier also lacks advanced charting features and the ability to save more than a basic layout.
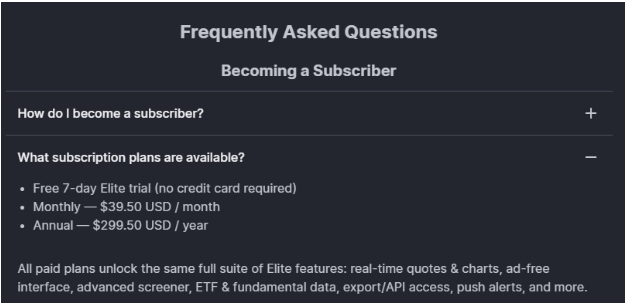
Finviz Elite (which typically costs around $39.50/month, or less with an annual plan) unlocks real-time data and crucial quality-of-life features. Elite members gain access to advanced charting tools, including performance comparisons and drawing tools, along with full access to custom filters and advanced backtesting capabilities. For a professional trader, the cost is justified by the immediate access to real-time quotes, which eliminates the execution risk of using delayed data, and by the sheer power of the advanced backtesting engine. The upgrade shifts Finviz from being a preparatory tool to a vital real-time monitoring tool.
Finviz Pros, Cons, and User Verdict
Pros:
- Unmatched Speed: Filters and updates are nearly instantaneous.
- Superior Visualization: The heat maps provide the best sector-level overview available.
- Comprehensive Data: Access to stocks, futures, forex, and relevant news in one place.
- Excellent Free Tier: Highly functional for passive or long-term investors.
Cons:
- Delayed Data (Free): The 3-5 minute delay renders the free version unsuitable for active day trading.
- Basic Charting: Charts lack the depth and toolset of dedicated trading platforms.
- Limited Customization (Free): Custom layouts and advanced settings are restricted to Elite users.
User Verdict: Finviz is an indispensable resource, but its suitability depends entirely on your trading frequency. If you are a Swing Trader or a long-term position investor, the free version offers incredible value as a technical screening tool for nightly or weekly analysis. The data delay is manageable, and the screening capabilities are more than sufficient. However, if you are a Day Trader requiring real-time data for micro-moves and immediate execution, the Elite subscription is mandatory. Without Elite, Finviz is a powerful planning tool; with Elite, it transforms into a potent real-time market dashboard. Finviz’s strength lies in its ability to process and visualize data efficiently—it is best utilized as a complementary tool alongside a full-featured brokerage or charting platform.
Verdict: Who Should Use Finviz?
Finviz is universally recommended for:
- Swing Traders and Long-Term Investors: The free tier is perfect for building watch lists based on technical, fundamental, and descriptive criteria. It excels at finding candidates for trades over a period of days or weeks.
- Market Analysts: Anyone needing a quick, visual snapshot of daily market performance, sector rotation, and sector performance will find the heat maps invaluable for daily briefings and macro-level decision-making.
- Advanced Screeners: Traders who require the ability to combine dozens of unique fundamental filtering and technical parameters into repeatable scans will benefit most from the speed and granularity of Finviz Elite’s functionality. Finviz is less suited for high-frequency scalpers who need direct execution within their charting software.
Conclusion
Finviz.com has cemented its reputation by proving that powerful market analysis doesn’t have to be slow, complex, or ugly. Its commitment to visualization tools and sheer speed has made it the go-to stock screener for millions. From its world-class stock screener that processes data in the blink of an eye to its intuitive market maps that demystify sector movements, Finviz offers unmatched trading efficiency for traders who value their time. While the Free tier is a fantastic starting point, the Finviz Elite upgrade provides the necessary real-time data and advanced charting required by any serious active trader. Ultimately, Finviz is a vital piece of the professional trader’s toolkit, ensuring you spend less time searching for opportunities and more time analyzing and executing them.
Book Your Strategy Call
Stop suffering from data paralysis. The difference between searching and finding the best trades is often the tool you use. Book a call with Maverick Trading & Currencies today to discuss how to integrate Finviz and other elite tools into a cohesive, high-performance trading strategy.