Following the Footprints of Institutional Capital
Sector rotation signals often appear quietly. A sector that has been ignored for months stops declining. Price stabilizes, volatility compresses, and relative performance improves just enough to escape attention. This is often the earliest stage of sector rotation. Long before headlines or analyst upgrades appear, institutional capital begins repositioning. To trade with consistency, identifying sector rotation signals must be treated as a core market skill, just as important as understanding broader market cycles.
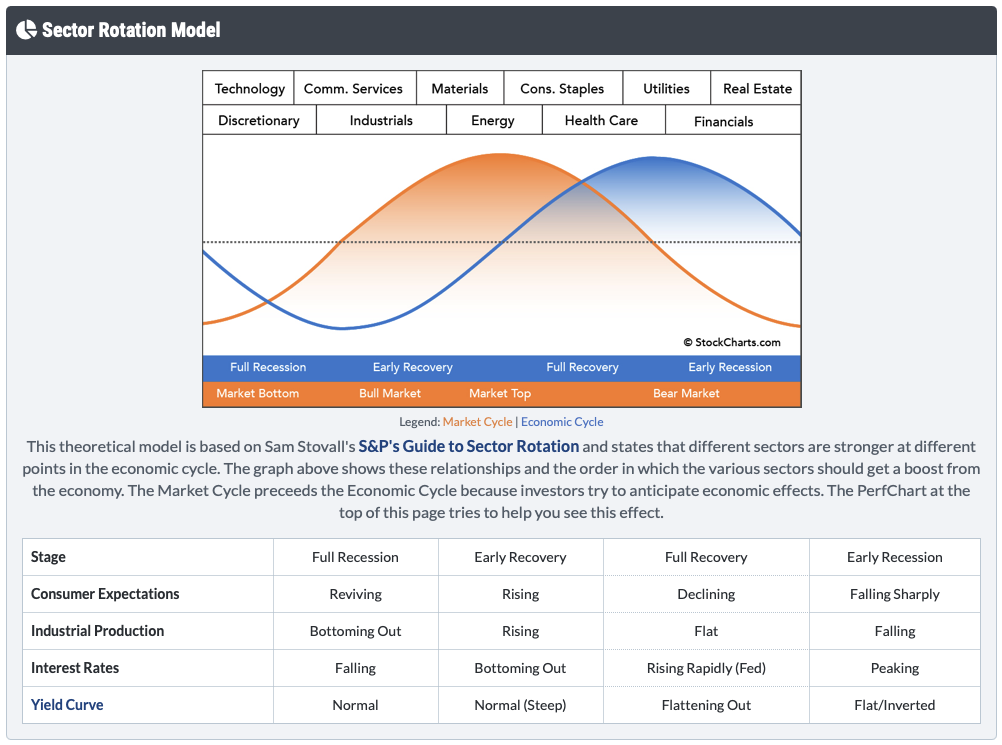
Sector rotation reflects how professional money responds to changing economic and business cycle conditions. The conceptual foundation for this sits within the Sector Rotation Model developed by Sam Stovall, chief investment strategist at Standard & Poor’s. Stovall’s work maps sector performance to phases of the economic cycle, suggesting that different sectors typically outperform at distinct stages of expansion and contraction. This framework has become a standard reference point for professionals trying to interpret where money is moving and why.
Capital does not leave the market all at once. It reallocates deliberately from one area to another. This post explores the objective sector rotation signals that suggest a new rotation is developing and how to recognize them before the move becomes obvious.
The Mechanics Behind Sector Rotation Signals
Markets do not move uniformly. Capital flows toward areas offering the best risk-adjusted opportunity within the current phase of the cycle. When conditions change, sector rotation signals begin to emerge.
According to the sector rotation model popularized by Stovall, the stock market tends to lead the economic cycle, with sectors rising and falling in somewhat predictable sequences. At certain points of the cycle, cyclical sectors such as technology and industrials historically exhibit relative strength. At other stages, defensive sectors like utilities and staples begin to attract capital.
Unlike momentum-driven moves, sector rotations are gradual. They often begin while the broader index continues higher, masking internal shifts. A sector can remain under accumulation for weeks while price stays range-bound. Understanding sector rotation is less about prediction and more about observation. Traders who understand how market cycles influence capital allocation are better positioned to adapt as leadership shifts.
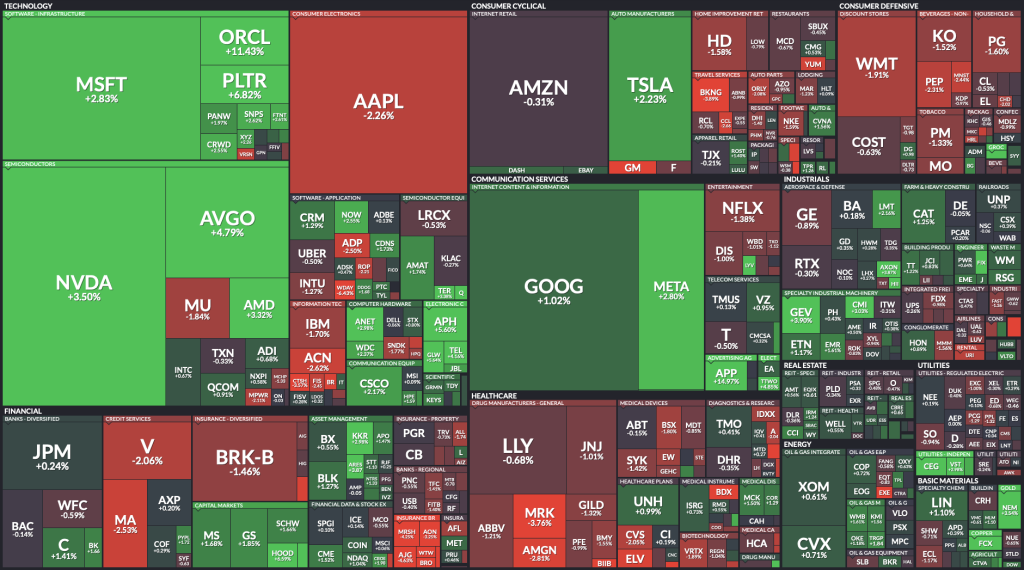
S&P Heat Map courtesy of finviz.com
Relative Strength as a Sector Rotation Signal
One of the earliest sector rotation signals is a change in relative strength versus the broader market. When a sector begins outperforming the index while price remains flat, it often signals accumulation rather than speculation.
This behavior reflects institutions building positions without forcing price higher. While many traders wait for breakouts, professional capital frequently enters earlier, accepting time risk in exchange for better positioning. Improving relative strength during consolidation is often one of the market’s first objective clues that sector rotation is underway.
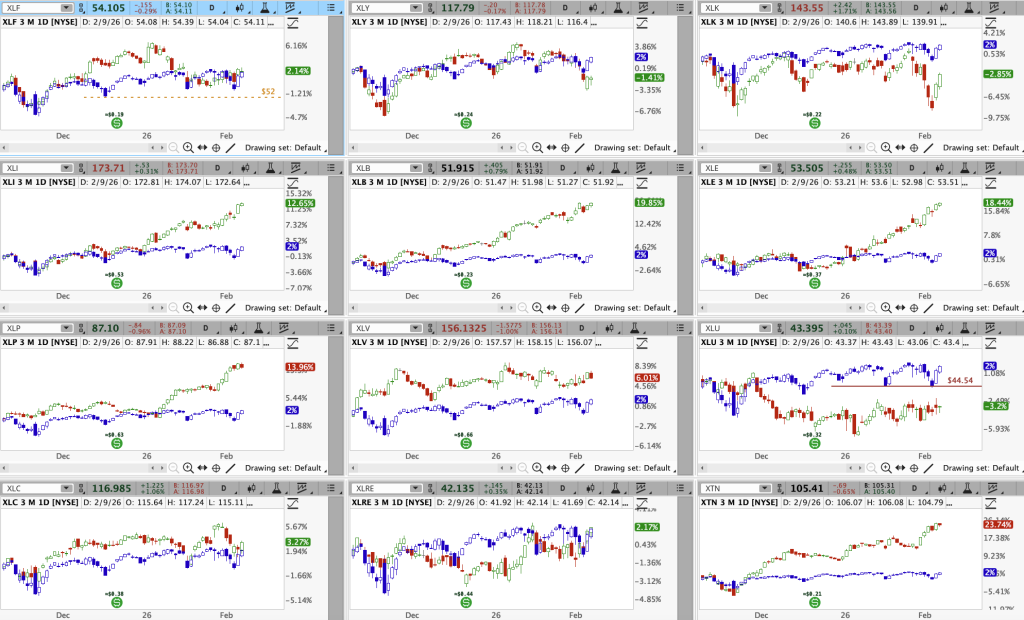
The chart below reflects a three-month lookback comparing each sector in the S&P versus the S&P itself. This can be a practical way to observe sector rotation signals developing in real time.
Capital Flows Reveal Intent
Fund flows often move before price trends become obvious. When capital consistently flows into a sector ETF while price remains muted, it suggests longer-term positioning rather than short-term trading activity.
At the same time, previously leading sectors may begin experiencing subtle outflows. Leadership narrows, participation weakens, and strong news produces diminishing returns. This behavior aligns with common institutional trading strategies, where capital is redeployed quietly to minimize market impact.
Understanding how institutions manage exposure can provide insight into where money is going before price confirms the shift.
Leadership Stocks Change Character
Every strong sector is driven by a small group of leaders. When those stocks begin stalling, failing to follow through after earnings, or showing signs of distribution, sector rotation signals often strengthen.
Simultaneously, stocks in a different sector may begin tightening their ranges, absorbing selling pressure, and holding gains efficiently. This change in behavior matters more than index-level movement. When leadership changes, sector trends typically follow.
Interest Rates and Sector Rotation Signals
Interest rates act as a structural force on sector performance. Certain sectors benefit from rising rates, while others perform better when rates stabilize or decline. The key signal is not the rate move itself, but how sectors respond to that environment.
When a sector stops reacting positively to conditions that previously supported it, capital is often preparing to rotate elsewhere. Observing these relationships helps traders understand why leadership shifts occur beneath the surface.
Breadth Expands as Rotation Gains Traction
Early-stage sector rotation signals are often accompanied by improved participation. More stocks within a sector begin making intermediate-term highs, and strength extends beyond one or two large-cap names.
This improvement often appears first through market breadth indicators, which reveal whether capital is broadly committed or narrowly concentrated. Expanding breadth is a common feature of emerging sector leadership, while narrowing breadth often appears near the end of a trend.
Trading Sector Rotation Signals, Not Headlines
Sector rotation is a process, not an event. Sector rotation signals tend to appear first through relative strength, capital flows, leadership behavior, and breadth. Price confirmation comes later.
The Sector Rotation Model articulated by Sam Stovall provides a meaningful conceptual backdrop for this process, tying sector performance to business cycle stages in a way traders can interpret and apply.
Traders who wait for headlines or obvious breakouts are often late. Traders who anticipate without evidence are guessing. The edge lies in recognizing sector rotation signals as they align and applying a disciplined risk management framework as the market transitions.
Trading alongside institutional capital requires patience, observation, and respect for how money actually moves.
Take the Trader Personality Test
Read:
Consistency in Trading: The Key To Long-Term Success
How to Read Stock Charts – Online Stock Chart Reading
Disclaimer: This content is provided for educational and informational purposes only. It does not constitute, and should not be relied upon as, personalized investment advice, a recommendation to buy or sell any security, or an offer to participate in any trading activity. Trading involves substantial risk, and past performance is not indicative of future results.