The Shooting Star
In the exclusive free video from Maverick Trading titled “Doji – Candlestick Patterns – Northern Doji and Southern Doji,” we break down how powerful candlestick formations can provide high-probability trading signals. This presentation gives traders clarity on when price indecision becomes a signal.
A shooting star candlestick is especially relevant. The shooting star will often appear after an uptrend. It has a small body near the lower end of the range, with a long upper shadow. This is a visual of trapped buyers and rising seller pressure. When combined with the indecision shown by a doji, traders can anticipate shifts in momentum before they become obvious.
This article will summarise key takeaways from the video. It also explains what a doji is (and why it matters). explore the shooting star’s role, show how to trade these patterns for higher-probability setups, and offer actionable tips for applying them in the markets.
What is a Doji Candlestick?
A doji candlestick forms when the opening and closing prices of a security are nearly the same. This results in a very small or non-existent real body while the upper and lower shadows may be long. Investopedia+2Strike Money+2
This pattern signals market indecision: neither buyers nor sellers can gain control. Because of that pause, the appearance of a doji often marks a potential turning point in price action. This can be significant, especially when it occurs after an extended trend. Wikipedia+1
The video emphasises that the “doji” in many forms (standard, long-legged, dragonfly, gravestone) acts as a warning sign — not a trade trigger by itself — but a moment where the market is choosing its next move.
The Shooting Star – What It Adds to the Signal
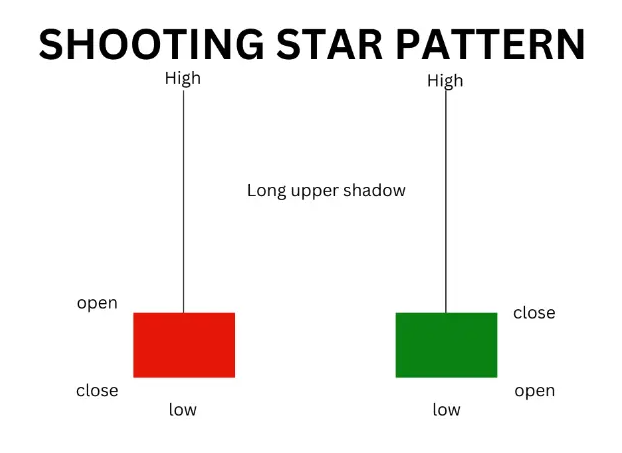
While the video’s main focus is doji patterns, it also references the value of spotting a shooting star formation alongside or after such indecision. A shooting star has a small body near the session low, a long upper shadow, and often appears after an uptrend. It signals that buyers pushed price up, but by the close sellers regained control.
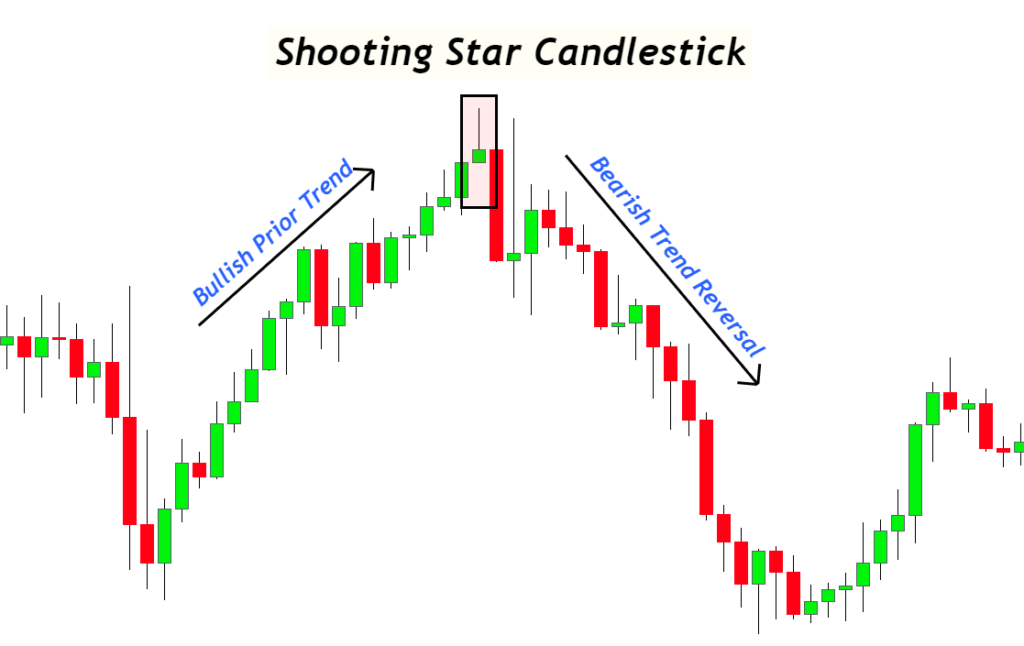
In other words: the shooting star shows the trend may be running out of steam, and when you combine that with a doji immediately before or after, the reversal odds go up. The video shows charts where this exact sequence (uptrend → doji or shooting star → confirmation) precedes a significant move.
Why Context and Confirmation Matter
One of the strongest themes in the video is: spotting a doji or shooting star is only half the battle — you must consider where it appears and what happens next.
- Location in the trend: A doji during sideways chop is less meaningful. But one at the end of a strong uptrend or downtrend often marks exhaustion. Wikipedia+1
- Volume and follow-through: The video shows that when a doji or shooting star is followed by a strong directional candle (with good volume), the probability of a valid trade setup improves.
- Supporting levels: Look for support/resistance zones, trendlines, or prior high/low levels near the pattern — that adds strength.
- Other indicators: While candlestick patterns can stand alone, combining them with momentum indicators (RSI, MACD), moving averages, or volume analysis adds robustness.
How to Trade the Doji / Shooting Star Sequence
Here’s a step-by-step method outlined in the video and reinforced by technical analysis best-practices:
- Trend assessment: Identify a clear uptrend or downtrend.
- Spot the pattern: A doji forms showing indecision or a shooting star appears showing seller pressure after an up move.
- Wait for confirmation: After the pattern, wait for the next candle to close strongly in the opposite direction (for reversal) or continue direction (for breakout).
- Enter the trade: Once confirmed, enter in direction of the follow-through.
- Set stop-loss & manage risk: Place stop just above the high of the pattern (for bearish reversal) or below the low (for bullish). Use position sizing to maintain proper risk-reward.
- Target & exit: Use prior swing highs/lows or measured move techniques to guide exits. Adjust stop to break-even as trade progresses.
The video from Maverick Trading illustrates examples of this approach with real price charts — you’ll see the trend → pattern → confirmation sequence visually laid out.
Real-World Examples from the Video
While the video offers several charted examples, here’s how to interpret them:
- After a strong uptrend, the chart shows a long white candle, followed by a small-bodied candle (a doji) or a shooting star. That signals buyers are weakening.
- The next session opens lower and closes lower, confirming that sellers have gained control. Entry is made on the breakout down, with a stop above the high of the chart pattern.
- In another scenario, after a downtrend, a long lower shadow doji appears (sometimes called dragonfly). This signals sellers may be exhausted and buyers stepping in — a bullish reversal setup.
By watching for these sequences and applying the rules above, you can increase your probability of catching meaningful moves.
Why This Matters for Traders
- Early warning system: Patterns like the doji and shooting star alert you that the trend may be near exhaustion. That gives you time to prepare, rather than getting surprised.
- Improved timing: Rather than entering blindly after a reversal is already underway, these patterns help you enter closer to the pivot and reduce risk.
- Greater discipline: Waiting for confirmation and context helps reduce false signals and emotional entries — which the video emphasises.
- Adaptable to timeframes: Whether you’re day trading, swing trading, or position trading, the pattern logic holds — though you’ll need to adjust your risk management accordingly.
Final Thoughts
If you’re serious about enhancing your technical analysis toolkit, the video “Doji – Candlestick Patterns – Northern Doji and Southern Doji” from Maverick Trading is a must-watch. By understanding the subtle but powerful messages communicated by a doji — and by spotting a shooting star at the right time — you’ll gain a sharper edge in identifying trend reversals or shifts in momentum.
Remember: the pattern alone is not a free ticket. It’s the context, the confirmation, and the execution plan that turn a simple pattern into a trade. Apply these principles, stay disciplined, and you’ll strengthen your ability to act on meaningful moves, rather than reacting to noise.
Tune into the free video in Maverick Trading’s library now, practice spotting these patterns on chart replay, and incorporate the doji + shooting star logic into your next trading plan. With consistent application, you’ll move from noticing patterns to using them profitably.